implement grafana observability system
Objective:
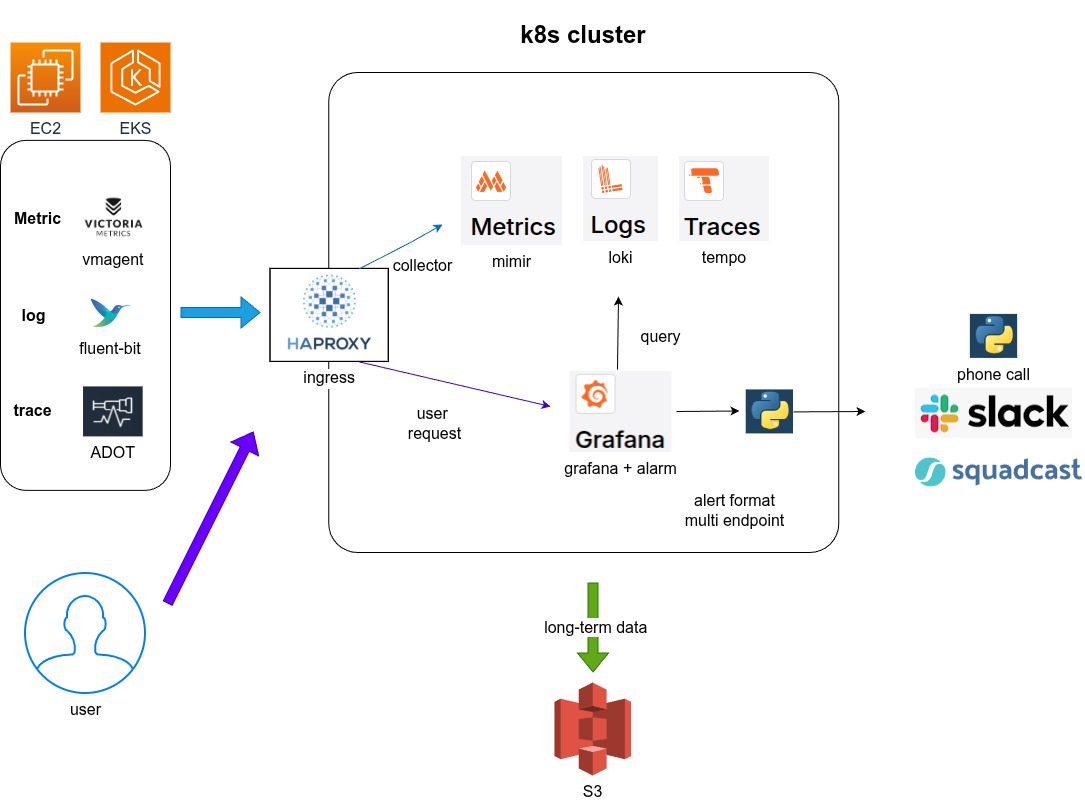
To migrate the existing monitoring architecture to the Grafana observability stack, unifying metrics, logs, and traces into a single, cohesive platform.
將現有的監控架構遷移至 Grafana 可觀測性堆疊,將指標 (metrics)、日誌 (logs) 和追蹤 (traces) 統一到一個單一且連貫的平台中。
Challenges (Before):
- Inefficient Metric Collection: Relied on custom Bash/Python scripts to collect and send metrics to CloudWatch, resulting in high maintenance overhead and a lack of standardization.
- 低效的指標收集:依賴自定義的 Bash/Python 腳本收集指標並發送至 CloudWatch,導致維護成本高且缺乏標準化。
- Inefficient Log Analysis: Logs were archived to S3 and required manual download and extraction for querying, making real-time analysis impossible.
- 低效的日誌分析:日誌歸檔至 S3,查詢時需要手動下載和提取,無法進行即時分析。
- Tracing: None.
- 追蹤:無。
Solution (After):
Core Architecture (核心架構):
- CICD: Manage with IaC(HELM) , and multi-environment rollouts via ArgoCD.
- CICD:使用 IaC (Helm) 進行管理,並透過 ArgoCD 進行多環境部署。
- Dynamic Configuration: Managed dashboards and alerts via ConfigMaps or custom container images, support for both automatic and manual provisioning.
- 動態配置:透過 ConfigMaps 或自定義容器映像檔管理儀表板和告警,支援自動和手動配置。
- Metrics (Mimir): Collection: Used lightweight VictoriaMetrics agents and custom-built exporters for metric collection.
- 指標 (Mimir):收集:使用輕量級 VictoriaMetrics 代理和自建 exporters 進行指標收集。
- Logs (Loki): Collection: Utilized Fluent-bit for log collection, filtering, and parsing at the source.
- 日誌 (Loki):收集:利用 Fluent-bit 在源頭進行日誌收集、過濾和解析。
- Traces (Tempo): Collection: Used AWS Distro for OpenTelemetry for trace collection and processing.
- 追蹤 (Tempo):收集:使用 AWS Distro for OpenTelemetry 進行追蹤收集和處理。
Results & Achievements:
- Unified Observability: Full support for custom metrics, dashboards, and alerts tailored to various business needs.
- 統一的可觀測性:全面支援針對各種業務需求量身定制的自定義指標、儀表板和告警。
- Real-time Log Insights: Enabled real-time log querying, parsing, and the ability to create dashboards and alerts directly from log data.
- 即時日誌洞察:實現即時日誌查詢、解析,並能夠直接從日誌數據創建儀表板和告警。
- Efficient Troubleshooting: Achieved distributed tracing, allowing engineers to correlate logs and metrics via a Trace ID, drastically improving the time to find and resolve issues.
- 高效故障排除:實現分佈式追蹤,允許工程師透過 Trace ID 關聯日誌和指標,大幅縮短發現和解決問題的時間。
- Streamlined Management: Multi-tenancy improved data governance and usability for different teams.
- 簡化管理:多租戶架構改善了不同團隊的數據治理和易用性。
- Integrated Alerting: Supported multiple alert notification endpoints, including Slack, Squadcast, and phone calls, ensuring timely incident response.
- 整合告警:支援多種告警通知端點,包括 Slack、Squadcast 和電話,確保及時的事故響應。
- Cost Optimization: Utilized S3 for long-term trace storage.
- 成本優化:利用 S3 進行長期的追蹤存儲。
- Agent: use ansible/helm to deploy agent and exporter.
- 代理程式:使用 ansible/helm 部署代理程式和 exporter。
- Backend: all backend Deployed a highly available and performant distributed cluster.
- 後端:所有後端皆部署為高可用且高效能的分佈式叢集。